


Wanlong Electric User Side Electrical Monitoring and Energy Consumption Management System in Ningbo *** Sewage Treatment Project


1and sewage treatment industry
China's "13th Five-Year Plan" clearly puts forward the planning content and improvement requirements for "accelerating the improvement of the ecological environment". For the development of the city, the number of new and original approved sewage treatment plant projects is increasing, and the sewage treatment plant The discharge and treatment requirements are also constantly improving. As a large sewage treatment plant in Ningbo with a long operation time, it is constantly required to improve its sewage treatment process and sewage treatment capacity. The latest treatment requirements are: to increase the daily domestic sewage treatment capacity by 80000 cubic meters; Simultaneously implement the effluent upgrading renovation of the existing treatment facilities for daily domestic sewage treatment of 240000 cubic meters; The construction of reclaimed water reuse facilities will reach a total scale of 64000 cubic meters per day based on 20% of the total sewage treatment volume; add 10 tons (dried sludge)/day sludge deep dewatering facility, and the moisture content of the dewatered sludge is less than 60%.
are not only the expansion of the plant, but also the application of new sewage treatment technology. In the sewage treatment process of sewage treatment plant, there are a large number of electrical equipment applications in the process of improving sewage and sludge, biological treatment support and sludge treatment. A large amount of energy consumption is a problem, especially in the process of sewage biological treatment and sludge treatment. The proportion of energy consumption is larger, and there is also a large energy consumption in the biochemical treatment stages such as aeration, sewage lifting and sludge treatment.
Due to the high energy consumption and high operating cost of sewage treatment plants, the construction and development of urban sewage treatment plants have played a greater hindrance. Therefore, it is necessary to increase the monitoring and management of sewage treatment processes and equipment energy consumption and big data statistics to improve and enhance the sewage treatment process, so as to achieve high efficiency and low energy of sewage treatment.
2. User side electrical monitoring and energy consumption management system
for the new sewage treatment plant, in the sewage treatment process of energy saving technology is the primary energy saving measures, whether it is pump head, aeration system, sludge treatment, ultraviolet disinfection, etc., the use of new technology is the most direct energy reduction measures. However, due to the urban development and the signed sewage contract agreement, the built sewage treatment plant often needs to operate synchronously with the built and put into use plant for a period of time to complete the alternation of new and old technologies while selecting new technologies for the expansion of the plant area. Then, for these built electrical equipment, the user side electrical monitoring and energy management system plays a huge role in energy efficiency control.
2.1 and User Side
The user-side electrical monitoring and energy consumption management system must first not only monitor the entire plant, but also increase the frequency of data collection for electrical equipment with higher energy consumption in combination with the process flow chart.
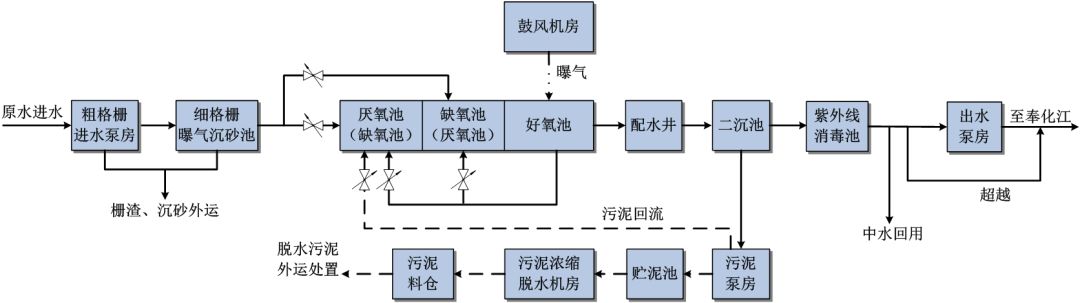
Figure 1 Sewage treatment and sludge treatment process flow chart
After the process technology exchange with Ningbo * * * sewage treatment plant, according to the process flow chart (fig. 1), the design of the user-side electrical monitoring and energy consumption management system is still composed of the station control layer, the spacer layer and the communication network connecting the two layers. in the electrical equipment data collected by the electrical monitoring of the sewage treatment plant, for the important areas with large process energy consumption (coarse grid inlet pump house, grit chamber, biological reaction tank, sludge pump house, discharge pump house, etc.), focus on collecting the operation data of relevant electrical equipment. At the same time, in order to strengthen the stability and reliability of data communication and reduce the communication interval time, double network redundancy is set for key electrical equipment.
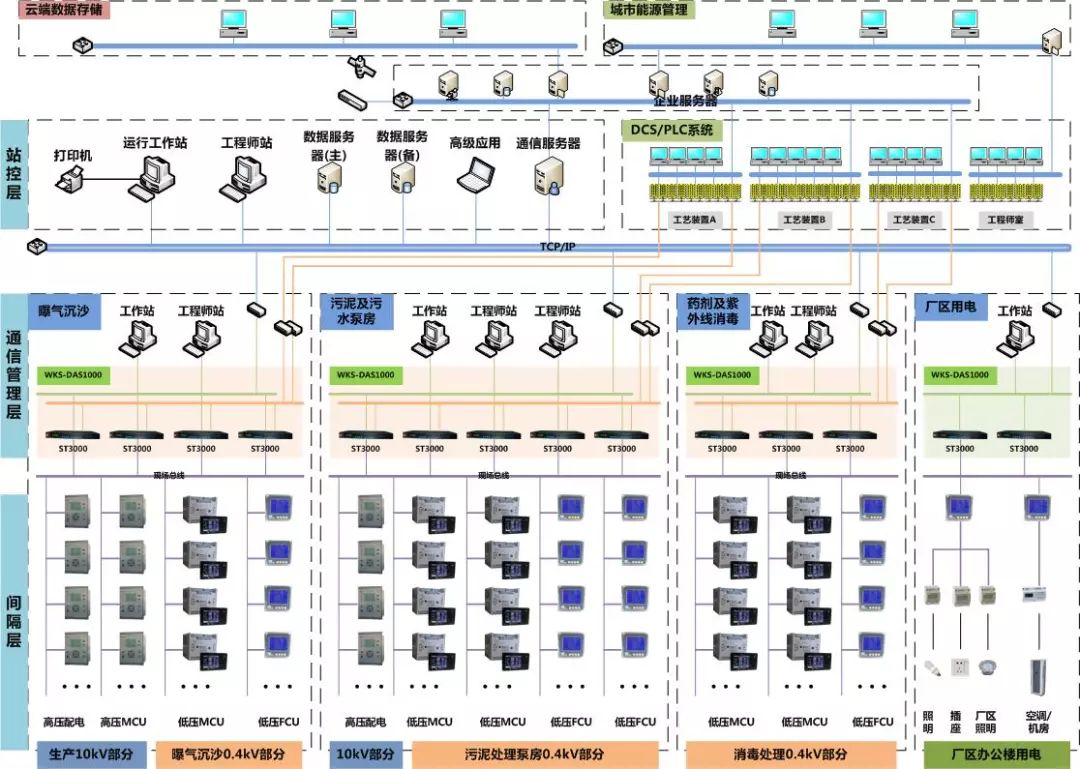
Figure 2 Electrical monitoring and energy management system network topology
2.2 and user side
2.2.1 Electrical Monitoring
Redesign and enhance the display of electrical equipment in the process section of the system monitoring interface, which is embodied in the form of electrical primary system diagram or cabinet layout diagram, to realize the observation of the whole power supply load situation and the monitoring of the load status of each circuit, to monitor the operation status of each electrical circuit on the site through icon and color switching, and to monitor the electrical parameters of the corresponding circuit with text and buttons, remote opening and closing operation control can be carried out when necessary. User-side electrical monitoring and energy consumption management at any time monitoring, real-time control, power data management analysis, etc., greatly improve the efficiency of power monitoring and management work, reduce manual inspection may be wrong.
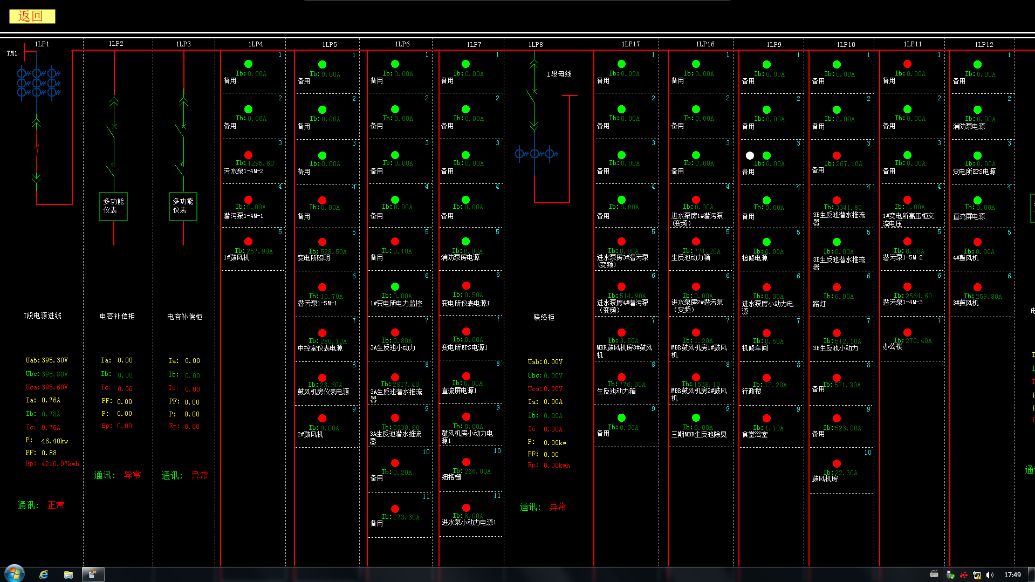
Figure 3 Electrical System Interface
2.2.2 Equipment Management
System Status List Displays the operating status, fault alarm, abnormal alarm, communication interruption and other normal and abnormal equipment status of each electrical equipment or intelligent unit connected to the system.
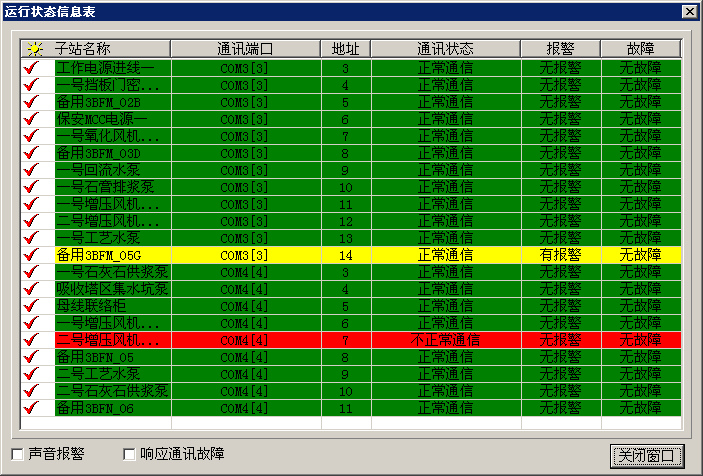
Figure 4 Device status interface
2.2.3 Energy Consumption Management
energy consumption data analysis is visually displayed in bar charts, pie charts and other graphics to view real-time trend charts and historical curves of all analog quantities. View a one-hour real-time trend graph of a settable analog quantity. View the real-time bar chart of analog quantity and the historical bar chart of electrical measurement. View the pie chart of peak, valley and flat electricity consumption for one day of electric measurement, and the pie chart of electricity consumption for one day of multiple electric measurement, with illustrations and pictures. Through the selection of year, month and day, search the historical report for viewing and printing out; The report can be automatically printed out according to the set time. And supports various formula calculations. Digitizing energy consumption data also makes daily energy reports more accurate and reliable.
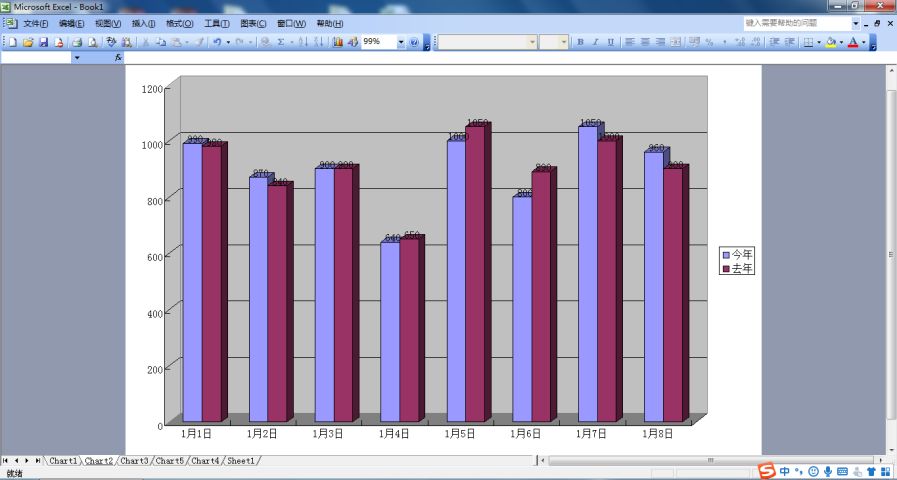
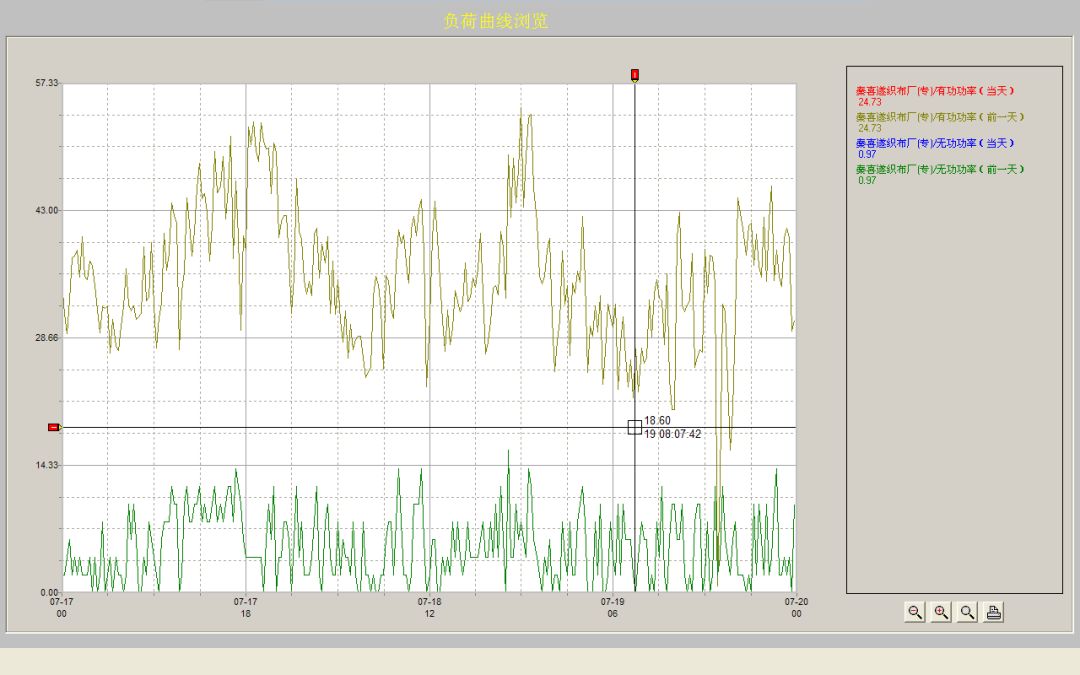
Fig. 5 Electrical energy consumption bar diagram and load curve diagram
A. sub-item electric energy statistics
Sewage Treatment Plant has carried out statistical management of itemized electric energy according to process section, load type and importance, which is convenient for users to analyze and summarize according to daily production management and energy consumption management. According to the process section, it includes intake pump room, aeration and sand settling part, sludge pump room part and disinfection treatment part; according to the load type, it includes production motor load, production lighting load, production auxiliary load, office lighting socket load, office air conditioning load, office power load and other types of load; according to the degree of importance, the sub-items include production safety load, production guarantee load, production auxiliary load, office area safety load, office area daily power load, etc. The graphic comparison (column comparison, pie comparison) automatically generated by the energy consumption report function is obviously intuitive in the emphasis of important electrical equipment, which is conducive to the comparative reference of electrical personnel on duty. At the same time, when the energy consumption is relatively large year-on-year or month-on-month, it can also be the most early warning information for this electrical aging fault, and the electrical duty personnel can update the equipment in time to prevent the occurrence of more serious faults.
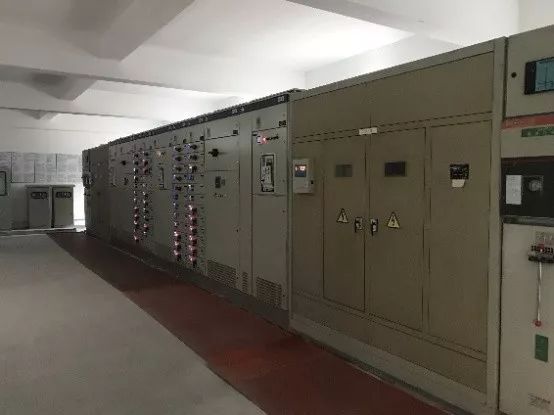
Figure 6 Transformation and Distribution Room (Sewage Pump House)
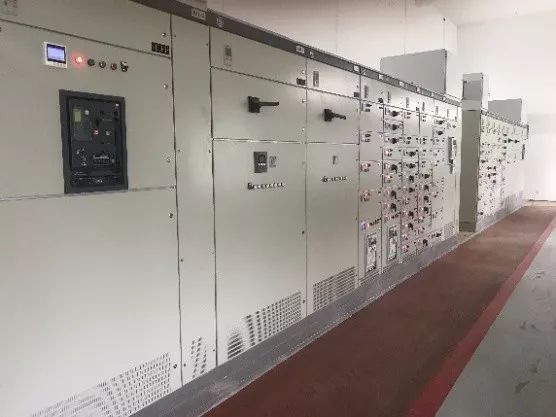
Fig. 7 Transformer and Distribution Room (Intake Pump House)
B. YoY Ring Analysis
In the design of sewage treatment plant, the scale of aeration system is usually determined by the hourly peak or daily peak oxygen demand, but in actual operation, reasonable control measures are adopted, so that even in the case of insufficient oxygen, the activated sludge turbidity can also run normally for a period of time without affecting the aeration effect. Then, through the electricity consumption data of the aeration system electrical equipment in the energy consumption management system, a 24-hour (or monthly) load bar chart or trend curve can be automatically generated. When comparing high and low peak data, and considering the support capacity and adjustment capacity comprehensively, the operation state of the aeration system equipment can be controlled and adjusted to reduce the energy waste that is too high at low peak time.

Figure 8 Aeration Equipment
C, energy-saving improvement decision-making
pump has a large amount of power consumption in the process of operation, so it is necessary to effectively improve the operation efficiency of the pump. At the same time of electrical monitoring, the energy consumption pie chart of each pump and the energy consumption pie chart of the same type and function pump. According to the pie chart of energy consumption, we can use frequency conversion equipment to update the pumps that are often operated at lower power after comparing the energy consumption data, and then apply them to the sewage system to reduce the long-term waste of resources. At the same time, in the actual pump start-up process, through energy consumption management, can be more accurate selection of high energy consumption equipment batch start-up and stop, further reduce the impact of the pump operation process on the power grid, according to the actual situation of reasonable and scientific operation, reduce the frequency of the corresponding pump start-up and stop.
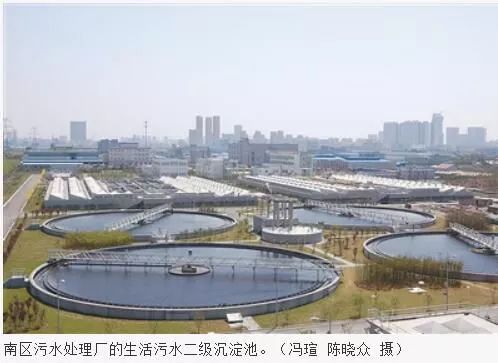
Fig. 9 Secondary Sedimentation Tank for Domestic Sewage
-
System and software products
-
Communication equipment set
-
DC integrated equipment
-
Communication switch electrical components
-
DC switchgear components
-
ꄶ Mechanical and Electrical Equipment Control Box
-
Medium-pressure protection device
-
ꄶ Circuit breaker accessories
-
ꄶ Low-voltage protection device
-
ꄶ Electrical fire protection device
-
ꄶ Multifunctional instrument
-
ꄶ Intelligent integrated device
-
Communication device
-
Current transformer
-
System and software products
-
Communication equipment set
-
DC integrated equipment
-
Communication switch electrical components
-
DC switchgear components
-
Mechanical and Electrical Equipment Control Box
-
Medium-pressure protection device
-
Low-voltage protection device
-
Electrical fire protection device
-
Multifunctional instrument
-
Intelligent integrated device
-
Communication device
-
Current transformer

